Comparing Economic Systems using Locus Maps
Locus Maps show the distribution of companies in geographically defined areas. Locus Maps enable users to compare the commercial compositions across different communities!
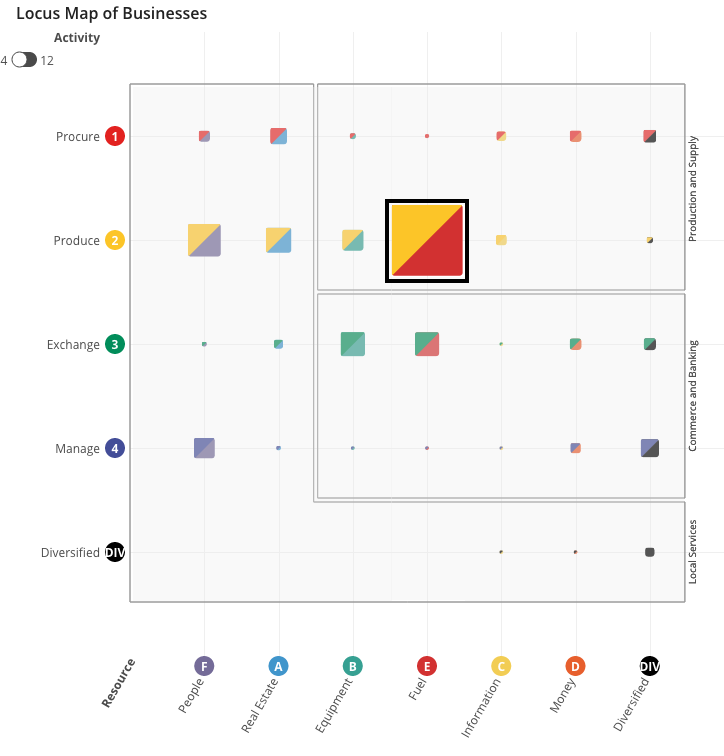
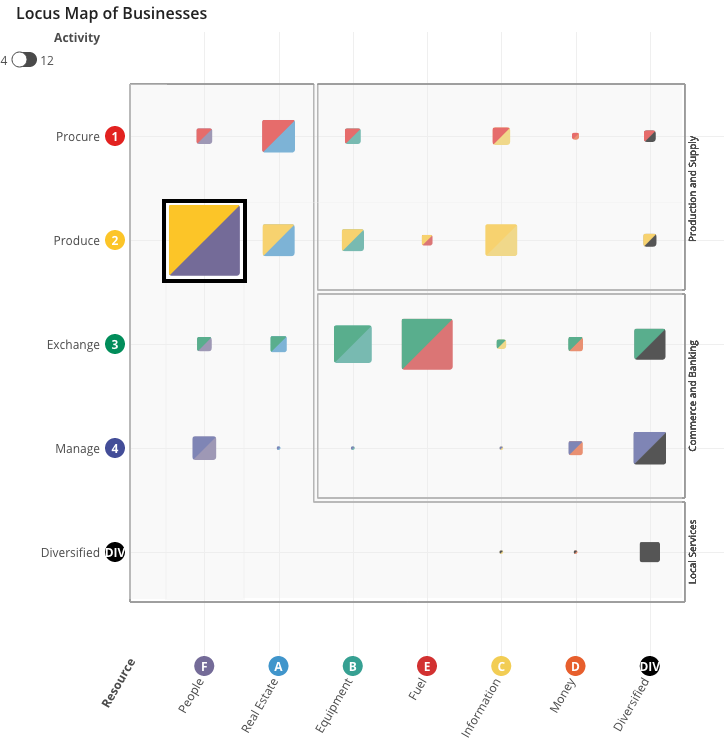
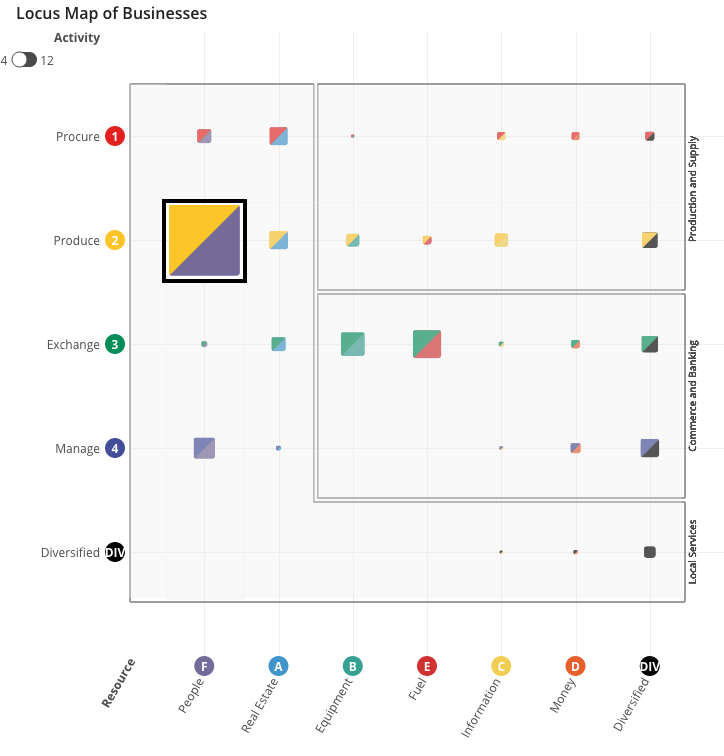
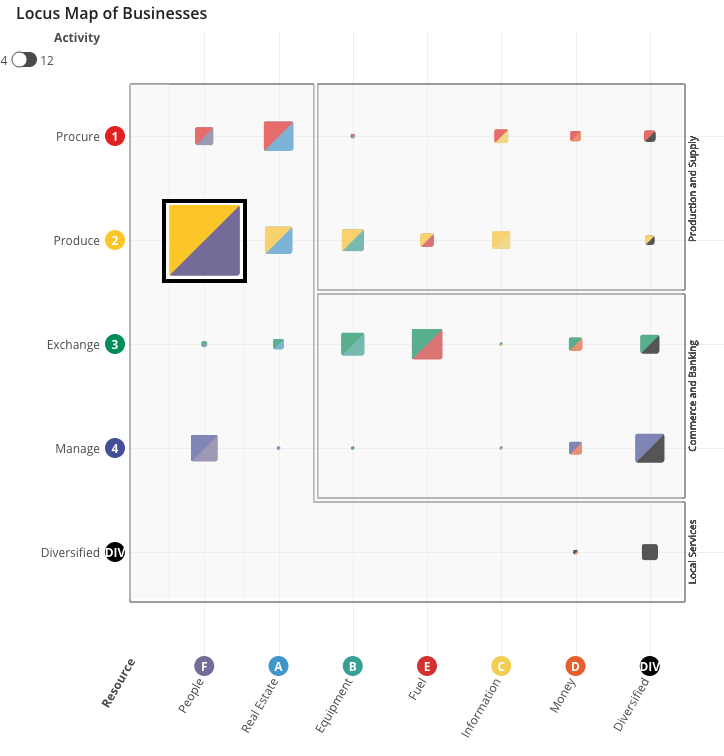
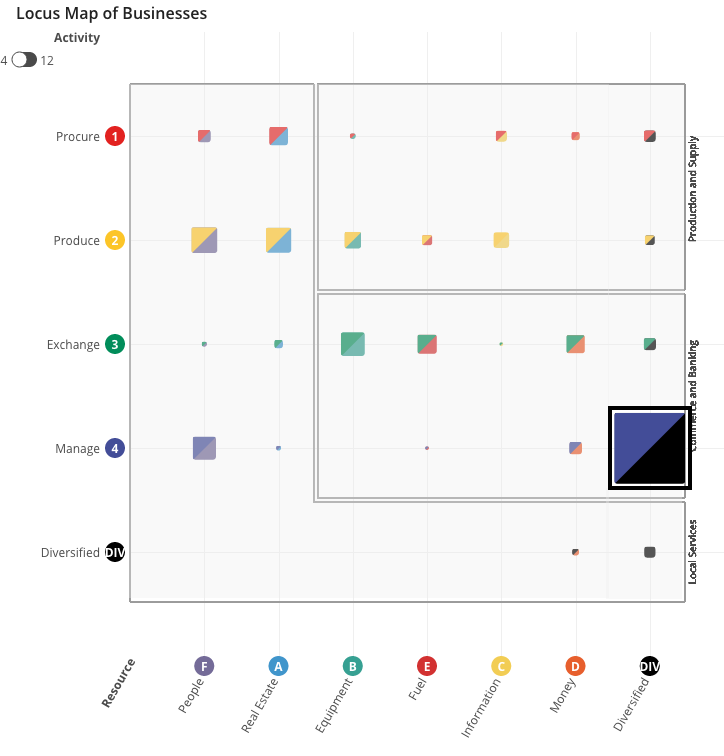
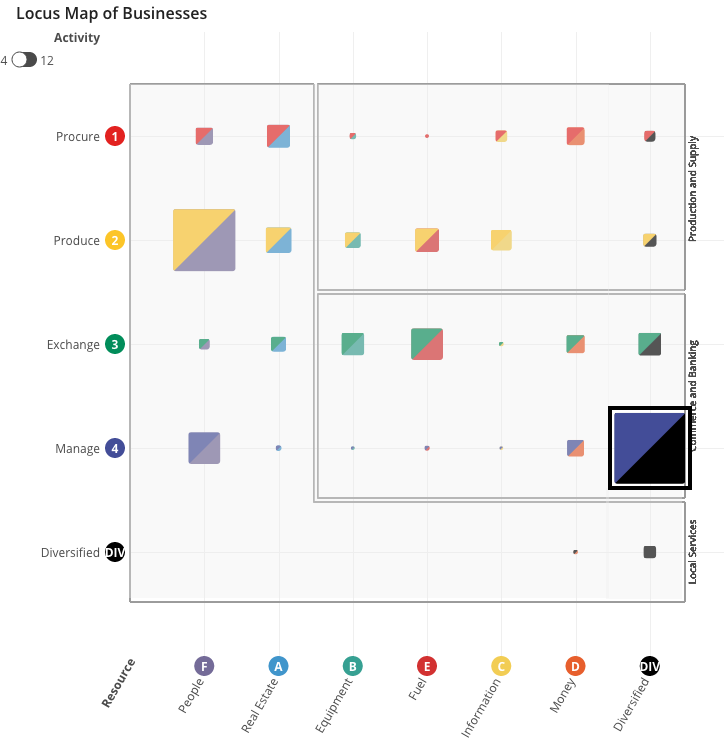
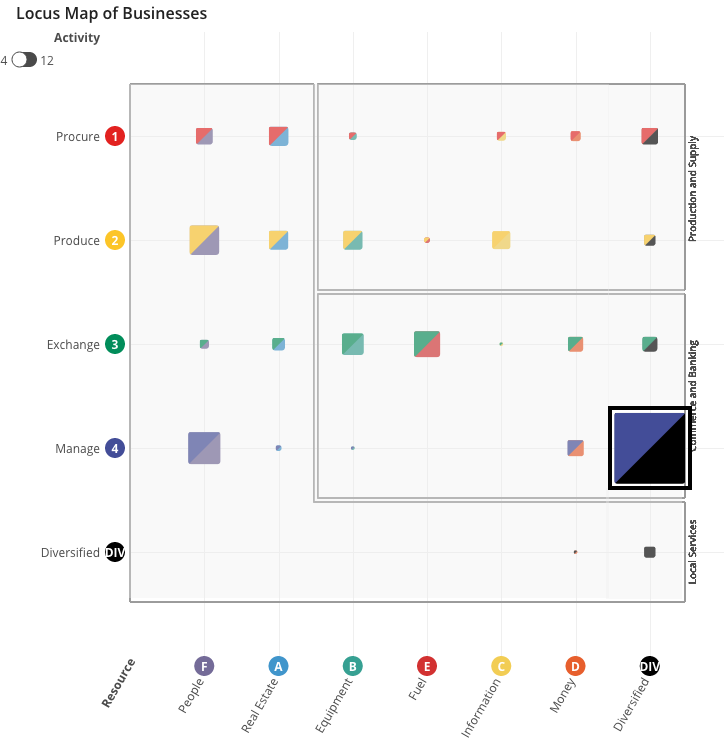
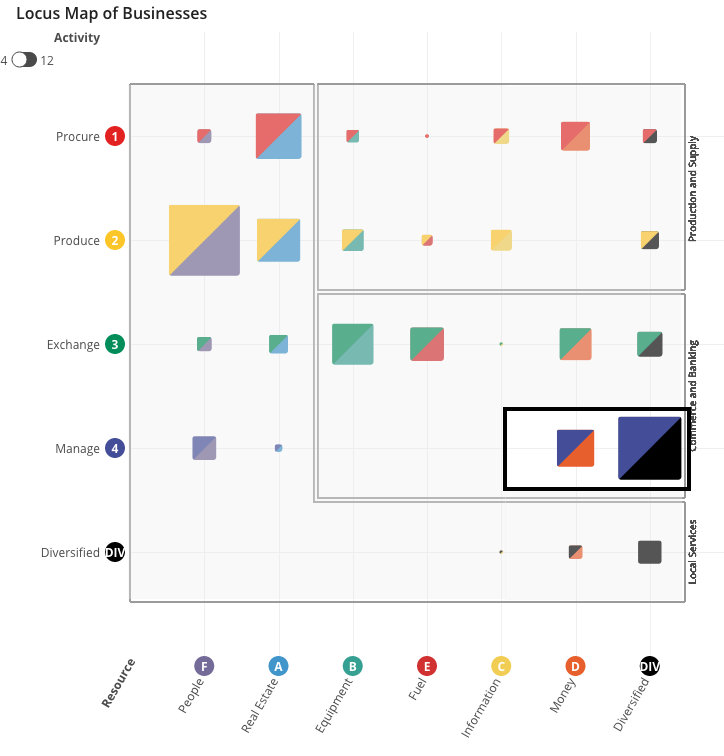
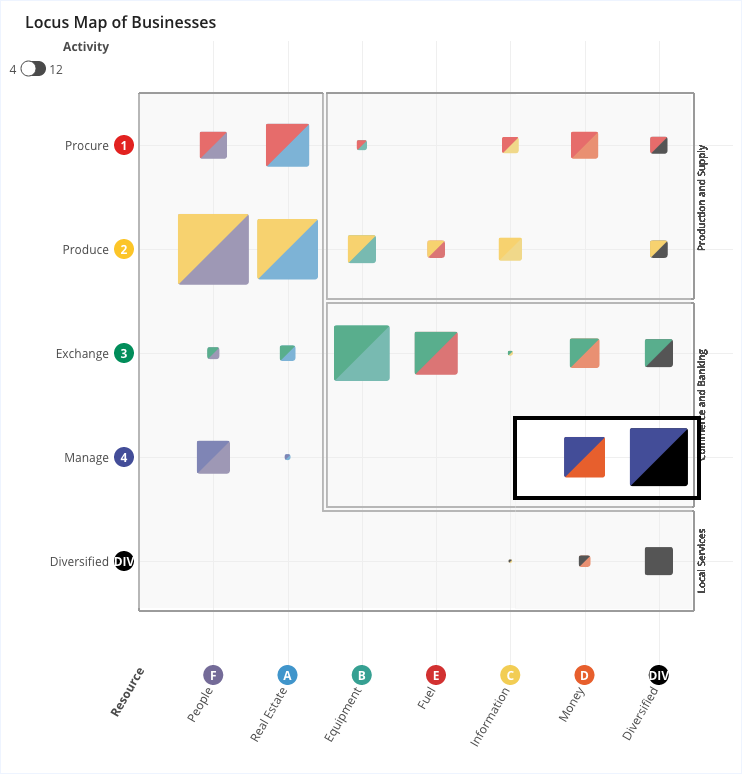
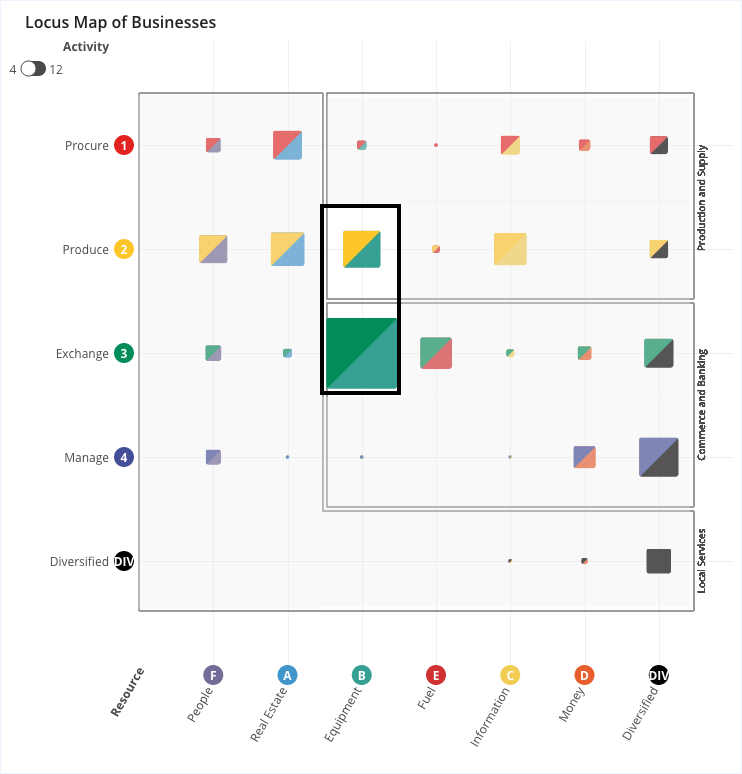
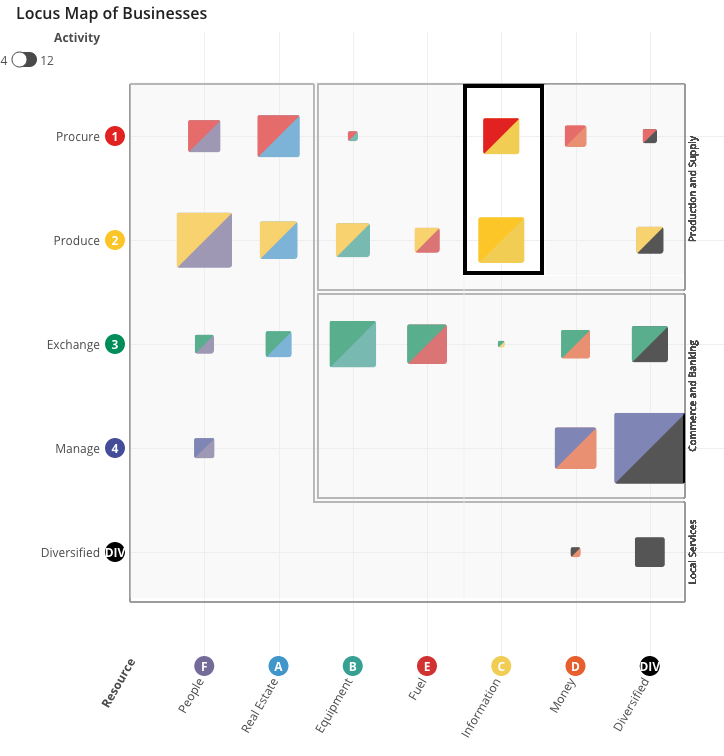
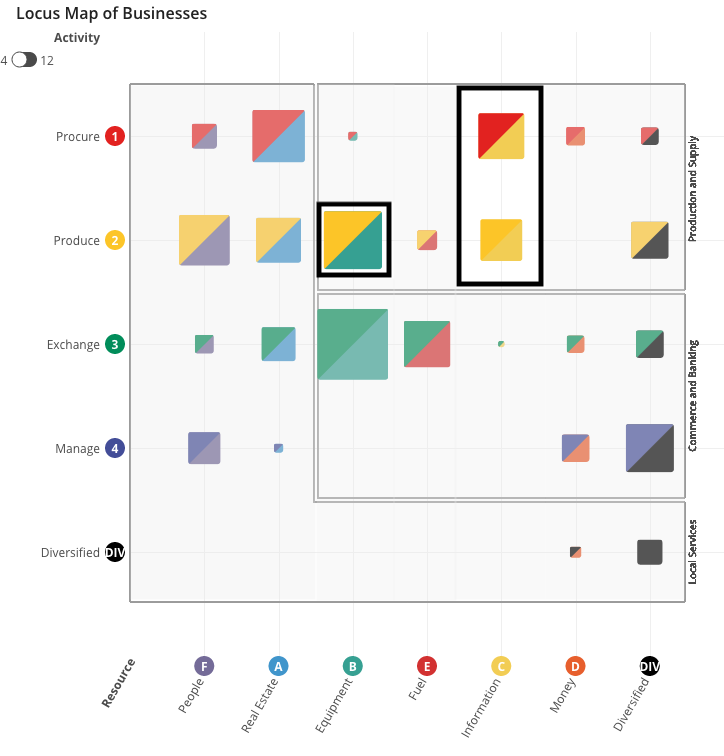
The Locus Model uses simple phrases to describe the products of economic agents -- we call this a locus. Just like English sentences, each locus is made up of a verb and an object; it’s as easy as saying “transports people” or “produces equipment”. The locus of an economic agent can also be thought as the functional location of that agent in the context of the larger economy. Locus Maps visualize loci by splitting the verb and object along the axes of a coordinate plane. As a result each box on the grid contains businesses that are functionally similar to each other.
By providing visual representations of loci, maps.locus allows users to identify unique typologies of economic communities. While economic activity isn’t distributed evenly across sub-regions, it does tend to cluster in identifiable ways. Because the Locus Maps are standardized, it’s easy to compare one geographic area (a zip code, a city, or a metropolitan area) to another and identify differences in the composition of businesses. Below, we’ll walk you through a few example Maps to show how best to utilize maps.locus to explore and compare economic compositions.
I. Comparing States using Locus Maps
Locus Maps of Agricultural States


II. Comparing Zip Codes using Locus Maps
Urban Residential Zip Codes
Central Business District Zip Codes
Financial Center Zip Codes
Specialty Industry Zip-Codes
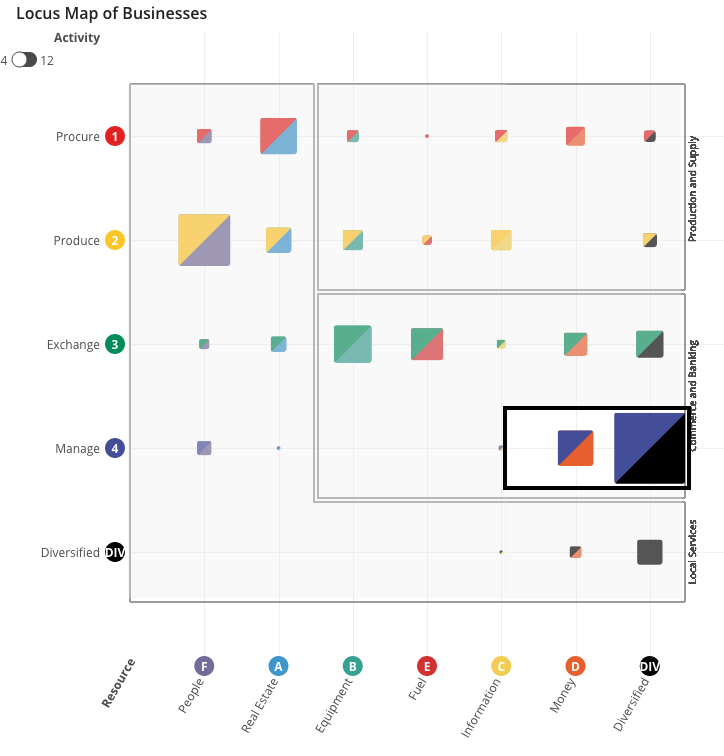
Locus Maps make it easy to visualize and compare economic specializations by region. These are three examples, each showing a different industry specialization.
- The fashion district in NYC has a higher proportion of businesses that produce and sell fabric and clothing.
- In Redwood City, Oracle and other info-tech startups cluster together in business parks.
- In San Jose, we see a large cluster of equipment manufacturers next to large clusters of software developers and platform providers. These activities seem to be closely linked -- equipment manufacturers and software/IT companies benefit from being geographically proximate.
Investigate More for Yourself
Here are some example types of zip codes to explore.
University zip codes:
University-adjacent tech developments:
The Future of Maps.Locus
In the current iteration of the Locus Map, boxes are sized based on the number of businesses with the given location. A bigger box for a given functional location indicates a more prevalent economic function in the selected universe. In future iterations, we plan to incorporate other sizing parameters, like revenue or number of employees, to allow for comparisons across multiple dimensions. Because the Locus language can also be used to describe jobs, we plan to incorporate employment data into the app to allow users to identify and compare labor distributions between geographic areas.